Aggregate reports for the turn and river
As of v162, GTO+ offers aggregate reports for the turn and river.
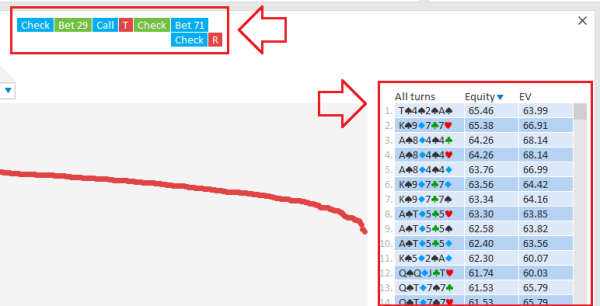
You can use the navigator to view the decision for which you want to see the data for every possible board runout.
Click on the red ‘T’ or ‘R’ button to move to the turn/river.
Requirements: v155 or higher
For this feature, all trees in the database need to have been solved with v155 or higher.
“Basic” versus “Extensive” storage
If “Basic” storage was used for solving the trees, then it’s possible to navigate up to the turn.
If “Extensive” storage was used, then it’s possible to navigate to the river as well.
For the turn, the following data will be available: Equity, EV, betting frequencies.
For the river, only betting frequencies are available (otherwise the savefiles would become too large).
Double-click a tree to load it into the editor
If “Extensive” storage was used for the trees, then you can double-click any line in the table to load it into the editor.
It’s important to observe that the equity/EV/frequency data in the table is the data as it was when the solve ended.
It’s entirely possible for the frequencies in the recalculation to be different from the ones in the table.
In particular, when looking at river data, a live recalculation will be performed when loading the tree.
This phenomenon will be more likely to occur if a line is rarely reached (meaning that it was never given full attention during solving).
Sorting the table
The table can be sorted according to equity, ev, betting frequency, or board runout.
For this, left-click on the title of a column above the table.
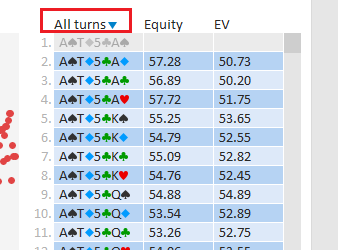
When sorting according to board runout (“All turns” in the screenshot below), then the table will be sorted for all possible turn+river runouts. This will include runouts that conflict with the board (runouts with conflicts will be grayed out). This is done, so that if the contents are exported to an external program, it’s easier to process with the turn+river runouts being consistent between all the flops.
Maximum number of flops
When navigating the aggregate reports up to the river, a maximum number of flops has been set to the graphical interface of roughly 400 flops per database. Beyond that, the table will no longer be displayed. This is because, when going over roughly 400 flops, the table would contain roughly 1 million lines of content. This amount of content is not really practical to work with anymore, and also makes the interface too slow. It’s however still possible to export the contents of the table to a riveraggregate.txt file in the same directory as GTO.exe. Exporting this magnitude of data may however take some time, so the program may appear to freeze while exporting.