Using the Line Filter Tool

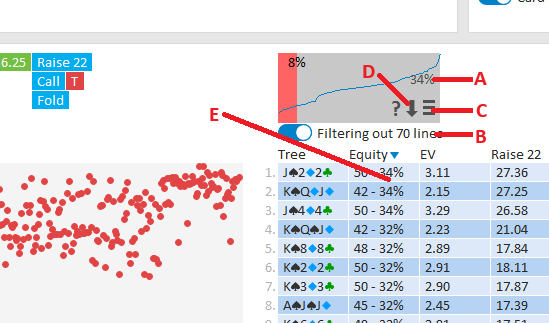
The Line Filter tool shows how often lines in the table are reached.
- The value in the upper right corner (A) displays the highest frequency found in the table.
- Toggle Filter out rare lines (B) to remove rare lines.
- The red area indicates the cutoff for filtering.
- At the top center of this area, the cutoff frequency is displayed (8% in the example).
To customize the cutoff conditions, click the Options field (C).
Available settings include:
- Filter for top X% – Keeps only the top X% of the graph area (measured by surface).
- Filter out all lines below X% – Removes any line with a frequency below X%.
- Always allow lines above X% of highest value – e.g. if set to 25% and the highest frequency is 80%, any line above 20% will be kept.
To view frequency values for each line, click the arrow icon (D).
- For Turn/River reports, this is shown in the first column.
- For Aggregate reports, it appears in the second column (to the right of the Equity/Action value).
Note: This method may feel a bit clunky, but it was the most efficient way to include frequencies without removing other data.
